In today’s fast-paced development environment, logging and monitoring are essential practices for ensuring the smooth operation of backend applications. Whether you are managing a simple application or a complex distributed system, these practices provide valuable insights into application behavior, enabling you to diagnose issues, optimize performance, and ensure a seamless user experience.
What is Logging?
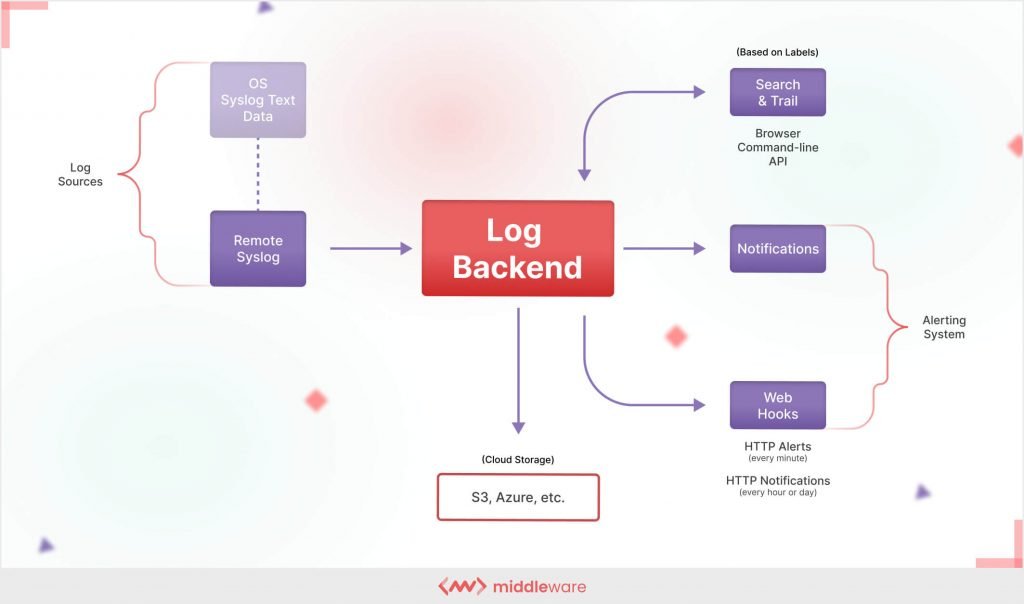
Logging is the process of recording information about application events, errors, and performance into log files. These logs are instrumental in debugging, auditing, and understanding the flow of an application.
Benefits of Logging:
- Debugging: Logs provide detailed information about application failures or anomalies.
- Audit Trail: They help in tracing changes and tracking user activities.
- Performance Insights: Logs can reveal bottlenecks and slow operations.
- Security Monitoring: Logs can detect suspicious activities or breaches.
Types of Logs:
| Log Type | Description | Example |
|---|---|---|
| Error Logs | Capture application errors or exceptions. | ERROR: Database connection failed |
| Event Logs | Record significant application events. | EVENT: User login successful |
| Debug Logs | Contain detailed application flow for troubleshooting. | DEBUG: API request received |
| Audit Logs | Track user activities for compliance and auditing. | AUDIT: File uploaded by user123 |
| Performance Logs | Capture metrics like response times and system loads. | PERFORMANCE: API latency 300ms |
What is Monitoring?
Monitoring refers to the process of continuously observing and analyzing the performance, availability, and health of backend applications. It typically involves the use of tools and dashboards to visualize metrics, set alerts, and analyze trends over time.
Benefits of Monitoring:
- Proactive Issue Detection: Identifies potential problems before they escalate.
- System Performance Optimization: Provides insights into resource usage and application efficiency.
- Enhanced User Experience: Ensures consistent application availability and reliability.
- Scalability: Helps plan for growth by analyzing historical data.
Key Metrics to Monitor:
| Metric | Description | Example |
| CPU Usage | Percentage of CPU resources consumed by the application. | 80% CPU usage |
| Memory Usage | Amount of memory used by the application. | 1.5GB RAM usage |
| Latency | Time taken to process requests. | 200ms API response time |
| Error Rates | Frequency of errors encountered. | 10 errors/min |
| Traffic | Number of requests processed. | 1,000 requests/min |
| Uptime | Total time the application remains operational. | 99.9% uptime |
Logging vs Monitoring
While logging and monitoring share a common goal of improving application reliability, they serve distinct purposes:
| Aspect | Logging | Monitoring |
| Purpose | Tracks detailed events and errors within the application. | Observes overall system health and performance metrics. |
| Granularity | High, focused on individual events. | Broad, focused on trends and system-wide behavior. |
| Tools | Log aggregators like ELK Stack, Loggly, Papertrail. | Monitoring tools like Prometheus, Grafana, Datadog. |
| Output | Text files or structured data. | Graphs, charts, and dashboards. |
Tools for Logging and Monitoring
Popular Logging Tools:
- ELK Stack (Elasticsearch, Logstash, Kibana):
- Open-source stack for managing and analyzing logs.
- Provides real-time search and analytics capabilities.
- Loggly:
- Cloud-based log management tool.
- Simplifies aggregation and analysis of logs.
- Papertrail:
- Lightweight solution for collecting and managing logs.
- Ideal for small to medium-sized applications.
Popular Monitoring Tools:
- Prometheus:
- Open-source tool for monitoring metrics.
- Provides powerful querying capabilities.
- Grafana:
- Visualization tool for monitoring dashboards.
- Integrates with multiple data sources like Prometheus.
- Datadog:
- Cloud-based monitoring and analytics platform.
- Offers comprehensive insights into application performance.
Best Practices for Logging and Monitoring
Logging Best Practices:
- Use structured logging (e.g., JSON format) for better readability.
- Include contextual information such as timestamps, request IDs, and user IDs.
- Avoid logging sensitive data like passwords.
- Implement log rotation to manage file sizes and retention.
Monitoring Best Practices:
- Define clear SLAs (Service Level Agreements) for performance metrics.
- Set up alerts for critical thresholds (e.g., high latency or memory usage).
- Use distributed tracing to monitor requests in microservices architecture.
- Regularly review and update monitoring dashboards.
Conclusion
Logging and monitoring are indispensable for maintaining the health and performance of backend applications. By implementing structured logging, choosing the right monitoring tools, and following best practices, developers and DevOps teams can ensure a reliable and efficient application ecosystem. Start integrating these practices today to gain deeper visibility and control over your backend systems.